Bu strateji burada yer alan Capissimo adlı kullanıcının 'Machine Learning: kNN-based Strategy' adlı göstergesi esas alınarak hazırlanmıştır.
'Machine Learning: kNN-based Strategy' adlı gösterge ile ilgili olarak yazarı tarafından yapılan açıklamanın Türkçesi aşağıdadır:
Bu strateji, bir sonraki (yarın, gelecek ay, vb.) piyasa hareketi için bir tahmin elde etmenizi sağlamak üzere klasik bir makine öğrenimi algoritması (k En Yakın Komşular (kNN)) kullanır. Denetimsiz bir makine öğrenme algoritması olan kNN, en basit öğrenme algoritmalarından biridir.
Bir sonraki piyasa hareketinin tahminini yapmak için kNN algoritması, 3 dizide (feature1, feature2 ve directions) toplanan geçmiş verileri kullanır ve mevcut gösterge(ler) değerlerinin k-en yakın komşularını bulur.
İki boyutlu kNN algoritması, geçmişte iki göstergenin benzer seviyede olduğu zamanlarda neler olduğuna bir göz atıyor. Daha sonra en yakın k komşuya bakar, durumlarını görür ve böylece mevcut noktayı sınıflandırır.
KNN algoritması, herhangi bir *tahmin değeri* olup olmadığını görmek için her türlü göstergeyi kolayca test etmek için bir çerçeve sunar.
Uyarı: Sinyaller yeniden boyama yapabilir!
Strateji dahilinde, stratejiye ait ön tanımlı değerler değiştirilebilir:
Esas alınan gösterge değerleri ile ilgili yapılabilecek değişiklikler
Strateji ile ilgili yapılabilecek değişiklikler
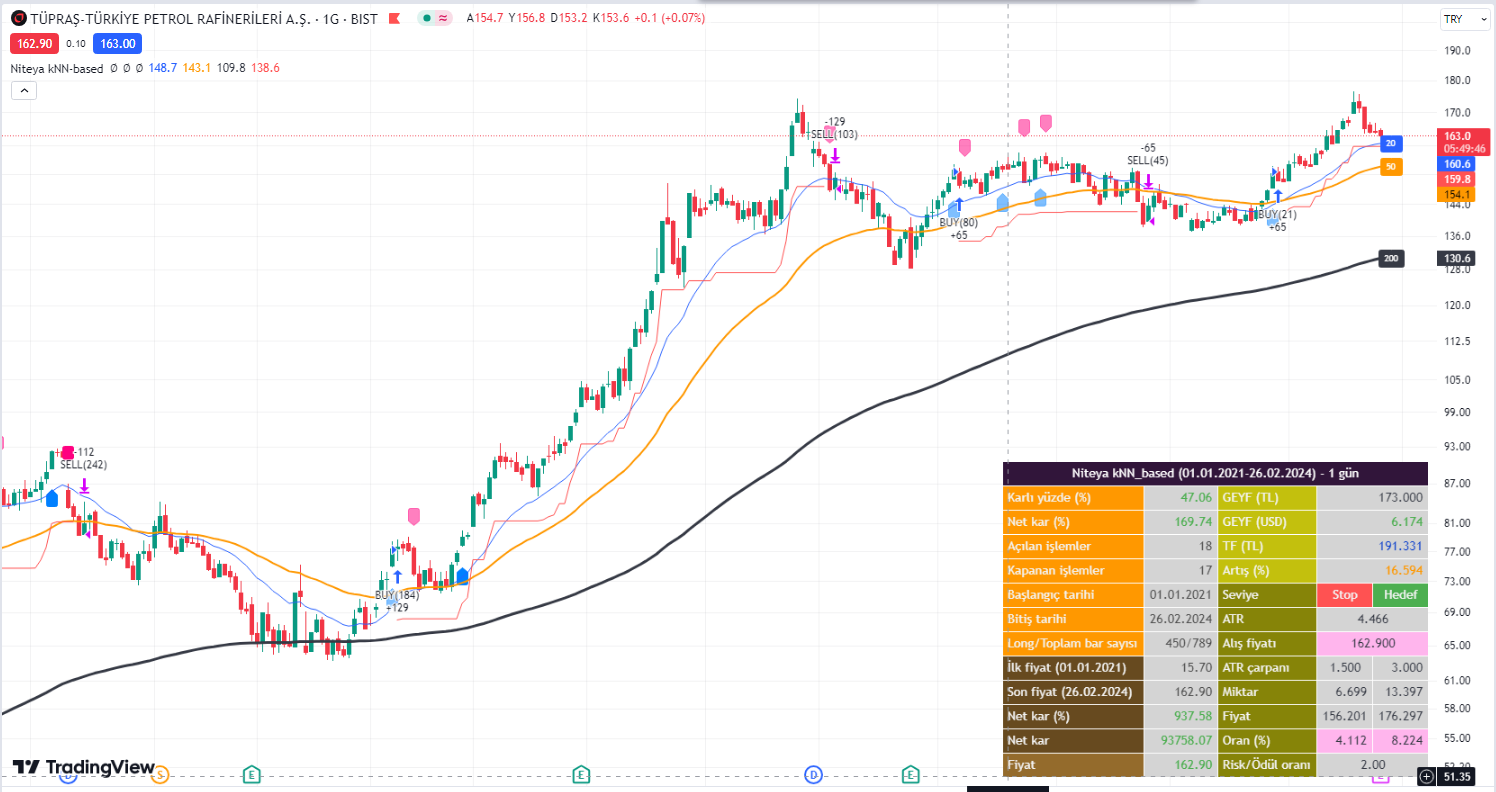
Aşağıdaki grafikte, stratejiyi yüklediğimizde ekrana gelecek olan tablonun değerleri ve açıklamaları gösterilmektedir:
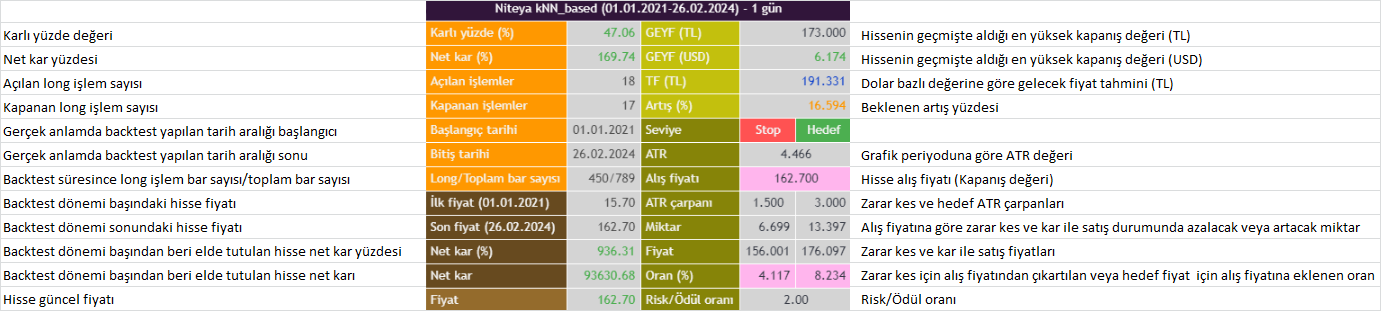
Stratejinin temel değerleri ve anlamları aşağıda gösterilmektedir:
Bu ayarlar, stratejinin "Ayarlar/Özellikler" sekmesinde değiştirilebilir.
 // This source code is subject to the terms of the Mozilla Public License 2.0 at https://mozilla.org/MPL/2.0/
// © Niteya
//@version=5
// Bu strateji https://tr.tradingview.com/v/GpcT4M6T/ adresindeki Capissimo adlı kullanıcının 'Machine Learning: kNN-based Strategy' adlı göstergesi esas alınarak hazırlanmıştır.
// Bu strateji şablonu sadece eğitim amaçlı olarak verilmiştir. Yatırım kararlarınızda kullanmayınız.
strategy("Niteya Strategy kNN-based", shorttitle='Niteya kNN-based', overlay=true, calc_on_every_tick=true, commission_value=0.04, initial_capital=10000, default_qty_type=strategy.cash, default_qty_value=10000)

////////////////////////////////////////////

Indicator = input.string('All', 'Indicator',  ['RSI','ROC','CCI','Volume','All'])
ShortWindow = input.int(14, 'Short Period [1..n]', 1)
LongWindow = input.int(28, 'Long Period [2..n]',  2)
BaseK = input.int (252, 'Base No. of Neighbours (K) [5..n]', 5)
Filter = input.bool (false, 'Volatility Filter')
Bars = input.int (300, 'Bar Threshold [2..5000]', 2, 5000)
show_labels = input.bool (true, 'Show labels')

// Backtest period
StartYear = input(2021, 'Backtest start year')
StartMonth = input(1, 'Backtest start month')
StartDay = input(1, 'Backtest start day')
PeriodStart = timestamp(StartYear, StartMonth, StartDay, 0, 0)

StopYear = input(9999, 'Backtest stop year')
StopMonth = input(12, 'Backtest stop month')
StopDay = input(31, 'Backtest stop day')
PeriodStop = timestamp(StopYear, StopMonth, StopDay, 0, 0)

// Constants
var int BUY = 1
var int SELL = -1
var int CLEAR = 0

var int k = math.floor(math.sqrt(BaseK))  // k Value for kNN algo

// Variable
// Training data, normalized to the range of [0,...,100]
var array<float> feature1 = array.new_float(0)  // [0,...,100]
var array<float> feature2 = array.new_float(0)  //    ...
var array<int> directions = array.new_int(0)    // [-1; +1]

// Result data
var array<int> predictions = array.new_int(0)
var float prediction  = 0.0
var array<int> bars = array.new<int>(1, 0) // array used as a container for inter-bar variables

// Signals
var int signal = CLEAR

// Functions
minimax(float x, int p, float min, float max) =>
    float hi = ta.highest(x, p), float lo = ta.lowest(x, p)
    (max - min) * (x - lo)/(hi - lo) + min

cAqua(int g) => g>9?#0080FFff:g>8?#0080FFe5:g>7?#0080FFcc:g>6?#0080FFb2:g>5?#0080FF99:g>4?#0080FF7f:g>3?#0080FF66:g>2?#0080FF4c:g>1?#0080FF33:#00C0FF19
cPink(int g) => g>9?#FF0080ff:g>8?#FF0080e5:g>7?#FF0080cc:g>6?#FF0080b2:g>5?#FF008099:g>4?#FF00807f:g>3?#FF008066:g>2?#FF00804c:g>1?#FF008033:#FF008019

//-- Logic
// 3 pairs of predictor indicators, long and short each
float rs = ta.rsi(close, LongWindow), float rf = ta.rsi(close, ShortWindow)
float cs = ta.cci(close, LongWindow), float cf = ta.cci(close, ShortWindow)
float os = ta.roc(close, LongWindow),  float of = ta.roc(close, ShortWindow)
float vs = minimax(volume, LongWindow, 0, 99), float vf = minimax(volume, ShortWindow, 0, 99)

float f1 = switch Indicator
    'RSI' => rs
    'CCI' => cs
    'ROC' => os
    'Volume' => vs
    => math.avg(rs, cs, os, vs)

float f2 = switch Indicator
    'RSI' => rf
    'CCI' => cf
    'ROC' => of
    'Volume' => vf
    => math.avg(rf, cf, of, vf)

// Classification data, what happens on the next bar
int class_label = int(math.sign(close[1] - close[0]))

In_Period() =>
    time >= PeriodStart and time <= PeriodStop ? true : false

// Use particular training period
if In_Period()
    // Store everything in arrays. Features represent a square 100 x 100 matrix,
    // whose row-colum intersections represent class labels, showing historic directions
    array.push(feature1, f1)
    array.push(feature2, f2)
    array.push(directions, class_label)

// Core logic of the algorithm
int size = array.size(directions)
float maxdist = -999.0
// Loop through the training arrays, getting distances and corresponding directions.
if size>0
    for i=0 to size-1
        // Calculate the euclidean distance of current point to all historic points,
        // here the metric used might as well be a manhattan distance or any other.
        float d = math.sqrt(math.pow(f1 - array.get(feature1, i), 2) + math.pow(f2 - array.get(feature2, i), 2))

        if d > maxdist
            maxdist := d
            if array.size(predictions) >= k
                array.shift(predictions)
            array.push(predictions, array.get(directions, i))

// Get the overall prediction of k nearest neighbours
prediction := array.sum(predictions)

atr_10 = ta.atr(10)
atr_40 = ta.atr(40)

bool filter = Filter ? atr_10 > atr_40 : true // filter out by volatility or ex. ta.atr(1) > ta.atr(10)...

// Now that we got a prediction for the next market move, we need to make use of this prediction and
// trade it. The returns then will show if everything works as predicted.
// Over here is a simple long/short interpretation of the prediction,
// but of course one could also use the quality of the prediction (+5 or +1) in some sort of way, ex. for position sizing.

bool long  = prediction > 0 and filter
bool short = prediction < 0 and filter
bool clear = not(long and short)

if array.get(bars, 0)==Bars    // stop by trade duration
    signal := CLEAR
    array.set(bars, 0, 0)
else
    array.set(bars, 0, array.get(bars, 0) + 1)

signal := long ? BUY : short ? SELL : clear ? CLEAR : nz(signal[1])

int  changed         = ta.change(signal)
bool startLongTrade  = changed!=0 and signal==BUY
bool startShortTrade = changed!=0 and signal==SELL
bool clear_condition = changed!=0 and signal==CLEAR

knn_value = startLongTrade ? 1 : startShortTrade ? -1 : 0

float maxpos = ta.highest(high, 10)
float minpos = ta.lowest (low,  10)

// Visuals
plotshape(show_labels ? (startLongTrade ? minpos : na) : na, 'Buy', shape.labelup,   location.belowbar, cAqua(int(prediction*5)), size=size.small)  // color intensity correction
plotshape(show_labels ? (startShortTrade ? maxpos : na) : na, 'Sell', shape.labeldown, location.abovebar, cPink(int(-prediction*5)), size=size.small)
plot(show_labels ? (clear_condition ? close  : na) : na, 'ClearPos', color.rgb(68, 66, 46), 4, plot.style_cross)

////////////////////////////////////////////

is_trend = input.bool(false, title="Trend gücü", inline='adx')
trend_short = input.bool(false, title="In short", inline='adx')
is_volume = input.bool(false, title="Hacim", inline='volume')
volume_short = input.bool(false, title="In short", inline='volume')

// EMA giriş değerleri
var string ema_group = 'EMA değerleri'
ema_length1 = input(20, 'EMA length1', group=ema_group)
ema_length2 = input(50, 'EMA length2', group=ema_group)
ema_length3 = input(200, 'EMA length3', group=ema_group)
is_ema_lines = input.bool(true, title='MA çizgileri', group=ema_group)

var string buy_sell_group = 'ATR temelli alış ve satış seviye değerleri'
buy_method = input.string(title='Satın alma yöntemi', defval='Kaynak', options=['Kaynak', 'Kullanıcı tanımlı'], group=buy_sell_group)
buy_src = input(close, 'Satın alma kaynağı', group=buy_sell_group)
buy_val = input.float(defval=0.00, title='Alış fiyatı', group=buy_sell_group)
atr_period_buy = input.int(14, 'ATR periyodu', minval=1, step=1, group=buy_sell_group)
atr_mul_stop = input.float(1.50, title='ATR çarpanı (Stop loss)', group=buy_sell_group)
atr_mul_target = input.float(3.00, title='ATR çarpanı (Satış)', group=buy_sell_group)
is_buy_lines = input.bool(false, title='Satın alma, stop loss ve satış seviye çizgileri', group=buy_sell_group)

// EMA
ema_11 = ta.ema(close, ema_length1)
ema_12 = ta.ema(close, ema_length2)
ema_13 = ta.ema(close, ema_length3)

plot(is_ema_lines ? ema_11 : na, title="MA src1", color=color.blue, linewidth=1)
plot(is_ema_lines ? ema_12 : na, title="MA src2", color=color.orange, linewidth=2)
plot(is_ema_lines ? ema_13 : na, title="MA src3", color=color.black, linewidth=3)

var long_vals = "Long işlem çıkış değerleri"
sl_method = input.string('Short', title="Çıkış yöntemi", options=['Stop loss', 'Short', 'Both'], group=long_vals)
// Zarar durdur için ATR giriş değerleri
atr_period = input.int(14, 'Zarar durdur ATR periyodu', minval=7, step=1, group=long_vals)
atr_multiplier = input.float(3, 'Zarar durdur ATR çarpanı', minval=1.5, step=0.1, group=long_vals)

// DMI inputs
dmi_lensig = input.int(14, title="ADX Smoothing", minval=1, maxval=50)
dmi_len = input.int(14, minval=1, title="ADX DI Length")
dmi_level = input.int(25, minval=20, title="ADX level")
up = ta.change(high)
down = -ta.change(low)
plusDM = na(up) ? na : (up > down and up > 0 ? up : 0)
minusDM = na(down) ? na : (down > up and down > 0 ? down : 0)
trur = ta.rma(ta.tr, dmi_len)
plus = fixnan(100 * ta.rma(plusDM, dmi_len) / trur)
minus = fixnan(100 * ta.rma(minusDM, dmi_len) / trur)
sum = plus + minus
adx = 100 * ta.rma(math.abs(plus - minus) / (sum == 0 ? 1 : sum), dmi_lensig)
trend_value = adx>adx[1] and adx>=dmi_level and adx>=ta.sma(adx, 10) ? 1 : 0

// Volume calculations
volume_value = (volume >= 1.1 * ta.sma(volume, 10)) ? 1 : 0

var int long_index = 0
var float long_price = 0.00
var int stop_index = 0
var float stop_val = 0.00

var int long_no = 0
var int close_no = 0

// ATR hesaplama
atr_long = ta.atr(atr_period)

// İz süren stop hesaplama
stop_loss_atr = atr_multiplier * atr_long
Trail = 0.0
iff_1 = close > nz(Trail[1], 0) ? close - stop_loss_atr : close + stop_loss_atr
iff_2 = close < nz(Trail[1], 0) and close[1] < nz(Trail[1], 0) ? math.min(nz(Trail[1], 0), close + stop_loss_atr) : iff_1
Trail := close > nz(Trail[1], 0) and close[1] > nz(Trail[1], 0) ? math.max(nz(Trail[1], 0), close - stop_loss_atr) : iff_2

ema_200 = ta.ema(close, 200)

entry_long = knn_value==1 and (not na(ema_200) ? close>ema_200 : true) and (is_volume ? volume_value==1 : true) and (is_trend ? trend_value==1 : true)
entry_short = knn_value==-1  and (volume_short ? volume_value==1 : true) and (trend_short ? trend_value==1 : true)

entry_price_long = ta.valuewhen(entry_long, close, 0)

stop_loss_long = Trail

exit_long = close<stop_loss_long

// Aktif periyot
var int PeriodS1 = 0
var int PeriodS2 = 0

if barstate.isfirst
    if time >= PeriodStart
        PeriodS1 := timestamp(year(time), month(time), dayofmonth(time), 0, 0)
    else
        PeriodS1 := timestamp(year(PeriodStart), month(PeriodStart), dayofmonth(PeriodStart), 0, 0)

    if last_bar_time <= PeriodStop
        PeriodS2 := timestamp(year(last_bar_time), month(last_bar_time), dayofmonth(last_bar_time), 0, 0)
    else
        PeriodS2 := timestamp(year(PeriodStop), month(PeriodStop), dayofmonth(PeriodStop), 0, 0)

// Hissenin periyot içindeki ilk ve son fiyatı
var float close_s = na
var float close_e = na

if time >= PeriodS1 and na(close_s[1])
    close_s := close
else
    close_s := close_s[1]

if time >= PeriodS2 and na(close_e[1])
    close_e := close
else
    close_e := close_e[1]

var int bar_number_period = 0
var int bar_number_long = 0

bar_index_o = (last_bar_index - bar_index)

if In_Period()
    if entry_long and strategy.opentrades==0
        strategy.entry('long', strategy.long, comment='BUY' + '(' + str.tostring(bar_index_o+1) + ')')
        long_price := entry_price_long
        long_index := bar_index_o

        long_no += 1

    if strategy.opentrades>0 and (sl_method=='Both' ? exit_long or entry_short : (sl_method=='Stop loss' ? exit_long : entry_short))
        strategy.close('long', comment='SELL' + '(' + str.tostring(bar_index_o+1) + ')')

        close_no += 1

        stop_index := bar_index_o
        stop_val := close

        long_price := 0.00
        long_index := 0

    bar_number_period += 1
    if long_price!=0.00
        bar_number_long += 1

plot_con = In_Period() and strategy.position_size > 0

plot(plot_con and not exit_long ? stop_loss_long : na, style=plot.style_linebr, color=color.new(color.red, 0), linewidth=1, title='Stop loss level')
// plot(stop_loss_long, style=plot.style_linebr, color=color.new(color.red, 0), linewidth=1, title='Stop loss level')

// ATR temelli alım satım tablosu değerlerini hesaplama
price_src = buy_method=='Kaynak' ? buy_src : buy_val

atr_val_buy = ta.atr(atr_period_buy)

stop_price_decreased = atr_mul_stop * atr_val_buy
stop_price = price_src - stop_price_decreased
stop_rate = (100*stop_price_decreased)/price_src

target_price_increased = atr_mul_target * atr_val_buy
target_price = price_src + target_price_increased
target_rate = (100*target_price_increased)/price_src

GetWinRate(includeEvens = false) =>
	winTradeCount = strategy.wintrades + (includeEvens ? strategy.eventrades : 0)
	(winTradeCount / strategy.closedtrades) * 100

get_date(time_val) =>
    str.tostring(dayofmonth(time_val), "00") + '.' + str.tostring(month(time_val), "00") + '.' + str.tostring(year(time_val)) + ' (' + str.tostring(hour(time_val), "00") + ':' + str.tostring(minute(time_val), "00") + ':' +  str.tostring(second(time_val), "00") + ')'

cur_exchange = "USDTRY"

bar_number = last_bar_index+1

[close_ticker_cur, close_ticker_high_cur] = request.security(syminfo.tickerid, "D", [close[1], ta.highest(close[1], bar_number)], lookahead=barmerge.lookahead_on, currency=syminfo.currency)
[close_ticker_usd, close_ticker_high_usd] = request.security(syminfo.tickerid, "D", [close[1], ta.highest(close[1], bar_number)], lookahead=barmerge.lookahead_on, currency="USD")

usd_cur = request.security(cur_exchange, "D", close[1], lookahead=barmerge.lookahead_on) // Dollar exchange rate

var bool is_lines = false
var label label_ema1 = na
var label label_ema2 = na
var label label_ema3 = na

if barstate.islast
    string time_str = ''
    period = timeframe.period
    gwr = GetWinRate()
    text_color_wr = gwr > 0 ? color.green : gwr < 0 ? color.red : color.gray
    text_color_np = strategy.netprofit > 0 ? color.green : strategy.netprofit < 0 ? color.red : color.gray
    text_color_single = close_e-close_s > 0 ? color.green : close_e-close_s < 0 ? color.red : color.gray

    if is_buy_lines and not is_lines
        bar_past = bar_index[40]
        bar_past_label = bar_index[20]

        var line target_line = line.new(bar_index, target_price, bar_past, target_price, extend=extend.none, color=color.green, width=1)
        var line buy_line = line.new(bar_index, price_src, bar_past, price_src, extend=extend.none, color=color.blue, width=1)
        var line stop_line = line.new(bar_index, stop_price, bar_past, stop_price, extend=extend.none, color=color.red, width=1)

        linefill.new(target_line, buy_line, color=color.new(#59d68f, 50))
        linefill.new(buy_line, stop_line, color=color.new(#fd9292, 50))

        label_target = label.new(bar_past_label, target_price, text='Target: ' + str.tostring(target_price, '0.000') + ' (%' + str.tostring(target_rate, '0.000')  + ')', color=color.new(color.green, 0), style=label.style_label_center, textcolor=color.white, size=size.normal)
        label_src = label.new(bar_past_label, price_src, text='Buy: ' + str.tostring(price_src, '0.000') + ' - Risk/Reward ratio: ' + str.tostring(target_rate/stop_rate, '0.00'), color=color.new(color.blue, 0), style=label.style_label_center, textcolor=color.white, size=size.normal)
        label_stop = label.new(bar_past_label, stop_price, text='Stop: ' + str.tostring(stop_price, '0.000') + ' (%' + str.tostring(stop_rate, '0.000')  + ')', color=color.new(color.red, 0), style=label.style_label_center, textcolor=color.white, size= size.normal)

        is_lines := true

    tr = syminfo.currency=='TRY'

    switch
        period=="1" => time_str := '1 dakika'
        period=="3" => time_str := '3 dakika'
        period=="5" => time_str := '5 dakika'
        period=="15" => time_str := '15 dakika'
        period=="30" => time_str := '30 dakika'
        period=="45" => time_str := '45 dakika'
        period=="60" => time_str := '1 saat'
        period=="120" => time_str := '2 saat'
        period=="180" => time_str := '3 saat'
        period=="240" => time_str := '4 saat'
        str.pos(period, "D")>=0 => time_str := '1 gün'
        str.pos(period, "W")>=0 => time_str := '1 hafta'
        str.pos(period, "M")>=0 => time_str := '1 ay'

    var table m_table = table.new(position.bottom_right, columns=5, rows=13, bgcolor=color.rgb(212, 212, 212), border_width=1, border_color=color.white)

    table.merge_cells(m_table, 0, 0, 4, 0)

    table.merge_cells(m_table, 3, 1, 4, 1)
    table.merge_cells(m_table, 3, 2, 4, 2)
    table.merge_cells(m_table, 3, 3, 4, 3)
    table.merge_cells(m_table, 3, 4, 4, 4)

    table.merge_cells(m_table, 3, 6, 4, 6)
    table.merge_cells(m_table, 3, 7, 4, 7)
    table.merge_cells(m_table, 3, 12, 4, 12)

    last_time = StopYear==9999 ? time : PeriodStop

    period_start = str.tostring(dayofmonth(PeriodStart), "00") + '.' + str.tostring(month(PeriodStart), "00") + '.' + str.tostring(year(PeriodStart))
    period_end = str.tostring(dayofmonth(last_time), "00") + '.' + str.tostring(month(last_time), "00") + '.' + str.tostring(year(last_time))

    table.cell(m_table, 0, 0, "Niteya kNN_based (" + period_start + "-" + period_end + ")" + ' - ' + str.tostring(time_str), text_color=color.white, text_halign=text.align_center, text_size=size.normal, bgcolor=color.new(#31153a, 0))

    table.cell(m_table, 0, 1, 'Karlı yüzde (%)', text_color=color.rgb(244, 244, 244), text_halign=text.align_left, text_size=size.normal, bgcolor=color.orange)
    table.cell(m_table, 0, 2, 'Net kar (%)', text_color=color.rgb(244, 244, 244), text_halign=text.align_left, text_size=size.normal, bgcolor=color.orange)
    table.cell(m_table, 0, 3, 'Açılan işlemler', text_color=color.rgb(244, 244, 244), text_halign=text.align_left, text_size=size.normal, bgcolor=color.orange)
    table.cell(m_table, 0, 4, 'Kapanan işlemler', text_color=color.rgb(244, 244, 244), text_halign=text.align_left, text_size=size.normal, bgcolor=color.orange)
    table.cell(m_table, 0, 5, 'Başlangıç tarihi', text_color=color.rgb(244, 244, 244), text_halign=text.align_left, text_size=size.normal, bgcolor=color.orange)
    table.cell(m_table, 0, 6, 'Bitiş tarihi', text_color=color.rgb(244, 244, 244), text_halign=text.align_left, text_size=size.normal, bgcolor=color.orange)
    table.cell(m_table, 0, 7, 'Long/Toplam bar sayısı', text_color=color.rgb(244, 244, 244), text_halign=text.align_left, text_size=size.normal, bgcolor=color.orange)

    table.cell(m_table, 0, 8, 'İlk fiyat (' + str.tostring(dayofmonth(PeriodS1), "00") + '.' + str.tostring(month(PeriodS1), "00") + '.' + str.tostring(year(PeriodS1)) + ')', text_color=color.rgb(244, 244, 244), text_halign=text.align_left, text_size=size.normal, bgcolor=color.rgb(103, 74, 31))
    table.cell(m_table, 0, 9, 'Son fiyat (' + period_end + ')', text_color=color.rgb(244, 244, 244), text_halign=text.align_left, text_size=size.normal, bgcolor=color.rgb(103, 74, 31))
    table.cell(m_table, 0, 10, 'Net kar (%)', text_color=color.rgb(244, 244, 244), text_halign=text.align_left, text_size=size.normal, bgcolor=color.rgb(103, 74, 31))
    table.cell(m_table, 0, 11, 'Net kar', text_color=color.rgb(244, 244, 244), text_halign=text.align_left, text_size=size.normal, bgcolor=color.rgb(103, 74, 31))
    table.cell(m_table, 0, 12, 'Fiyat', text_color=color.rgb(244, 244, 244), text_halign=text.align_left, text_size=size.normal, bgcolor=color.rgb(148, 107, 44))

    if not na(gwr)
        table.cell(m_table, 1, 1, str.tostring(gwr, '0.00'), text_color=text_color_wr, text_halign=text.align_right, text_size=size.normal, bgcolor=color.rgb(212, 212, 212))
        table.cell(m_table, 1, 2, str.tostring((100*strategy.netprofit)/strategy.initial_capital, '0.00'), text_color=text_color_np, text_halign=text.align_right, text_size=size.normal, bgcolor=color.rgb(212, 212, 212))
        table.cell(m_table, 1, 3, str.tostring(long_no), text_color=#505050, text_halign=text.align_right, text_size=size.normal, bgcolor=color.rgb(212, 212, 212))
        table.cell(m_table, 1, 4, str.tostring(strategy.closedtrades), text_color=#505050, text_halign=text.align_right, text_size=size.normal, bgcolor=color.rgb(212, 212, 212))

    table.cell(m_table, 1, 5, str.tostring(dayofmonth(PeriodS1), "00") + '.' + str.tostring(month(PeriodS1), "00") + '.' + str.tostring(year(PeriodS1)), text_color=#505050, text_halign=text.align_right, text_size=size.normal, bgcolor=color.rgb(212, 212, 212))
    table.cell(m_table, 1, 6, str.tostring(dayofmonth(PeriodS2), "00") + '.' + str.tostring(month(PeriodS2), "00") + '.' + str.tostring(year(PeriodS2)), text_color=#505050, text_halign=text.align_right, text_size=size.normal, bgcolor=color.rgb(212, 212, 212))

    table.cell(m_table, 1, 7, str.tostring(bar_number_long) + '/' + str.tostring(bar_number_period), text_color=#505050, text_halign=text.align_right, text_size=size.normal, bgcolor=color.rgb(212, 212, 212))

    np = (close_e-close_s)*(strategy.initial_capital/close_s)

    table.cell(m_table, 1, 8, str.tostring(close_s, '0.00'), text_color=#505050, text_halign=text.align_right, text_size=size.normal, bgcolor=color.rgb(212, 212, 212))
    table.cell(m_table, 1, 9, str.tostring(close_e, '0.00'), text_color=#505050, text_halign=text.align_right, text_size=size.normal, bgcolor=color.rgb(212, 212, 212), tooltip=str.tostring(close_e, '0.00') + ' - ' + str.tostring(volume, '0')) // volume*close
    table.cell(m_table, 1, 10, str.tostring((100*np)/strategy.initial_capital, '0.00'), text_color=text_color_single, text_halign=text.align_right, text_size=size.normal, bgcolor=color.rgb(212, 212, 212))
    table.cell(m_table, 1, 11, str.tostring(np, '0.00'), text_color=text_color_single, text_halign=text.align_right, text_size=size.normal, bgcolor=color.rgb(212, 212, 212))
    table.cell(m_table, 1, 12, str.tostring(close, '0.00'), text_color=text_color_single, text_halign=text.align_right, text_size=size.normal, bgcolor=color.rgb(212, 212, 212))

    // TL ve USD fiyat bazında fiyat tahmin tablosu
    table.cell(m_table, 2, 1, 'GEYF (TL)', text_color=color.rgb(244, 244, 244), text_halign=text.align_left, text_size=size.normal, bgcolor=color.rgb(195, 192, 13), tooltip='Geçmiş en yüksek fiyat (TL)')
    table.cell(m_table, 2, 2, 'GEYF (USD)', text_color=color.rgb(244, 244, 244), text_halign=text.align_left, text_size=size.normal, bgcolor=color.rgb(195, 192, 13), tooltip='Geçmiş en yüksek fiyat (USD)')
    table.cell(m_table, 2, 3, 'TF (TL)', text_color=color.rgb(244, 244, 244), text_halign=text.align_left, text_size=size.normal, bgcolor=color.rgb(195, 192, 13), tooltip='Tahmini fiyat (TL)')
    table.cell(m_table, 2, 4, 'Artış (%)', text_color=color.rgb(244, 244, 244), text_halign=text.align_left, text_size=size.normal, bgcolor=color.rgb(195, 192, 13))

    table.cell(m_table, 3, 1, str.tostring(close_ticker_high_cur, "0.000"), text_color=color.black, text_halign=text.align_right)
    table.cell(m_table, 3, 2, str.tostring(close_ticker_high_usd, "0.000"), text_color=color.green, text_halign=text.align_right)
    table.cell(m_table, 3, 3, str.tostring(close_ticker_high_usd * usd_cur, "0.000"), text_color=color.rgb(3, 57, 204), text_halign=text.align_right)
    table.cell(m_table, 3, 4, str.tostring(((100*close_ticker_high_usd*usd_cur)/close_ticker_cur)-100, "0.000"), text_color=color.orange, text_halign=text.align_right)

    // ATR temelli alım ve satım değerleri tablosu
    table.cell(m_table, 2, 5, 'Seviye', text_color=color.rgb(244, 244, 244), text_halign=text.align_left, text_size=size.normal, bgcolor=color.rgb(134, 132, 8))
    table.cell(m_table, 3, 5, 'Stop', text_color=color.rgb(244, 244, 244), text_halign=text.align_center, bgcolor=color.red)
    table.cell(m_table, 4, 5, 'Hedef', text_color=color.rgb(244, 244, 244), text_halign=text.align_center, bgcolor=color.green)

    table.cell(m_table, 2, 6, 'ATR', text_color=color.rgb(244, 244, 244), text_halign=text.align_left, text_size=size.normal, bgcolor=color.rgb(134, 132, 8))
    table.cell(m_table, 2, 7, 'Alış fiyatı', text_color=color.rgb(244, 244, 244), text_halign=text.align_left, bgcolor=color.rgb(134, 132, 8))
    table.cell(m_table, 2, 8, 'ATR çarpanı', text_color=color.rgb(244, 244, 244), text_halign=text.align_left, bgcolor=color.rgb(134, 132, 8))
    table.cell(m_table, 2, 9, 'Miktar', text_color=color.rgb(244, 244, 244), text_halign=text.align_left, bgcolor=color.rgb(134, 132, 8), tooltip='Stop loss fiyat hesaplaması için alış fiyatından çıkartılan veya hedef fiyat hesaplaması için alış fiyatına eklenen miktar')
    table.cell(m_table, 2, 10, 'Fiyat', text_color=color.rgb(244, 244, 244), text_halign=text.align_left, bgcolor=color.rgb(134, 132, 8), tooltip='Stop loss veya hedef fiyatı')
    table.cell(m_table, 2, 11, 'Oran (%)', text_color=color.rgb(244, 244, 244), text_halign=text.align_left, bgcolor=color.rgb(134, 132, 8), tooltip='Stop loss fiyat hesaplaması için alış fiyatından çıkartılan veya hedef fiyat hesaplaması için alış fiyatına eklenen oran')
    table.cell(m_table, 2, 12, 'Risk/Ödül oranı', text_color=color.rgb(244, 244, 244), text_halign=text.align_left, bgcolor=color.rgb(134, 132, 8))

    table.cell(m_table, 3, 6, str.tostring(atr_val_buy, '0.000'), text_halign=text.align_center)
    table.cell(m_table, 3, 7, str.tostring(price_src, '0.000'), text_halign=text.align_center, bgcolor=color.rgb(255, 181, 237))

    table.cell(m_table, 3, 8, str.tostring(atr_mul_stop, '0.000'), text_halign=text.align_center)
    table.cell(m_table, 3, 9, str.tostring(stop_price_decreased, '0.000'), text_halign=text.align_right, tooltip=str.tostring(atr_mul_stop, '0.000') + ' * ' + str.tostring(atr_val_buy, '0.000'))
    table.cell(m_table, 3, 10, str.tostring(stop_price, '0.000'), text_halign=text.align_right, tooltip=str.tostring(price_src, '0.000') + ' - ' + str.tostring(stop_price_decreased, '0.000'))
    table.cell(m_table, 3, 11, str.tostring(stop_rate, '0.000'), text_halign=text.align_right, bgcolor=color.rgb(255, 181, 237), tooltip='(100 * ' + str.tostring(stop_price_decreased, '0.000') + ') / ' + str.tostring(price_src, '0.000'))

    table.cell(m_table, 4, 8, str.tostring(atr_mul_target, '0.000'), text_halign=text.align_right)
    table.cell(m_table, 4, 9, str.tostring(target_price_increased, '0.000'), text_halign=text.align_right, tooltip=str.tostring(atr_mul_target, '0.000') + ' * ' + str.tostring(atr_val_buy, '0.000'))
    table.cell(m_table, 4, 10, str.tostring(target_price, '0.000'), text_halign=text.align_right, tooltip=str.tostring(price_src, '0.000') + ' + ' + str.tostring(target_price_increased, '0.000'))
    table.cell(m_table, 4, 11, str.tostring(target_rate, '0.000'), text_halign=text.align_right, bgcolor=color.rgb(255, 181, 237), tooltip='(100 * ' + str.tostring(target_price_increased, '0.000') + ') / '+ str.tostring(price_src, '0.000'))

    table.cell(m_table, 3, 12, str.tostring(target_rate/stop_rate, '0.00'), text_halign=text.align_center, tooltip=str.tostring(target_rate, '0.00') + ' / ' + str.tostring(stop_rate, '0.00'))

    if is_ema_lines
        label.delete(label_ema1)
        label.delete(label_ema2)
        label.delete(label_ema3)

        label_ema1 := label.new(x=bar_index+2, y=ema_11, text=str.tostring(ema_length1), color=color.blue, style=label.style_label_center, textcolor=color.white, size=size.small)
        label_ema2 := label.new(x=bar_index+2, y=ema_12, text=str.tostring(ema_length2), color=color.orange, style=label.style_label_center, textcolor=color.white, size=size.small)
        label_ema3 := label.new(x=bar_index+2, y=ema_13, text=str.tostring(ema_length3), color=color.black, style=label.style_label_center, textcolor=color.white, size=size.small)
Yukarıdaki strateji ile ilgili bir uygulama aşağıdaki grafikte gösterilmektedir: